
While many investors typically feel that debt deals are “lower-risk” than equity deals in investment crowdfunding, I’ve always wondered if that’s really the case. As investors, we have plenty of options for where to put our money — like zero-risk savings accounts at banks currently offering 4.6% or even 5% interest! So, I decided to dig into the data on debt and revenue-share offerings to see if the interest rates are actually compensating investors for the risks they’re taking.
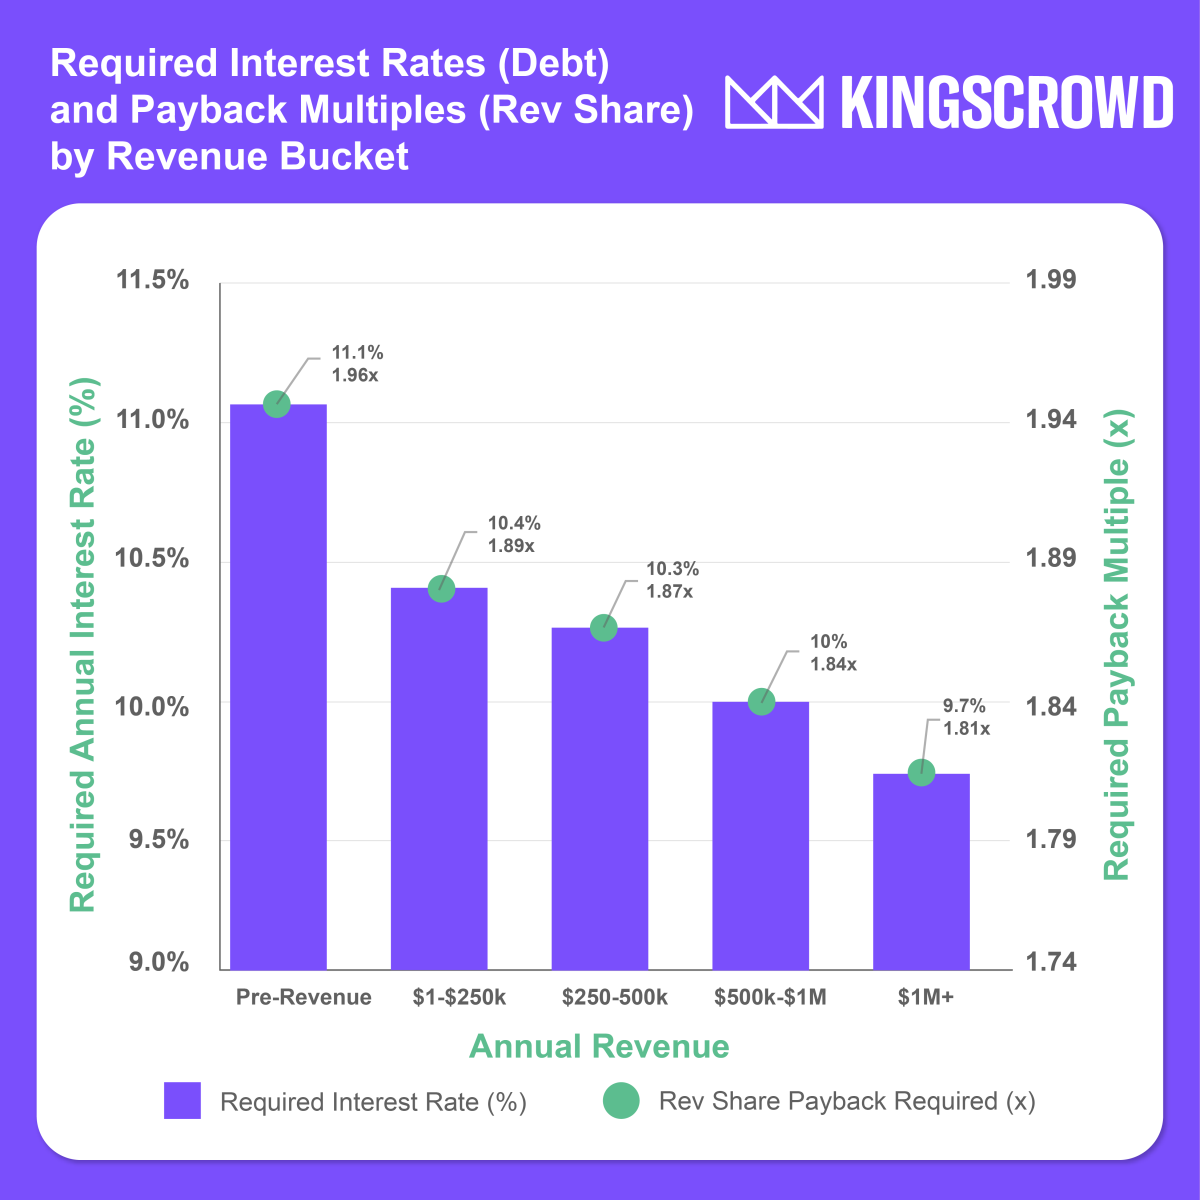
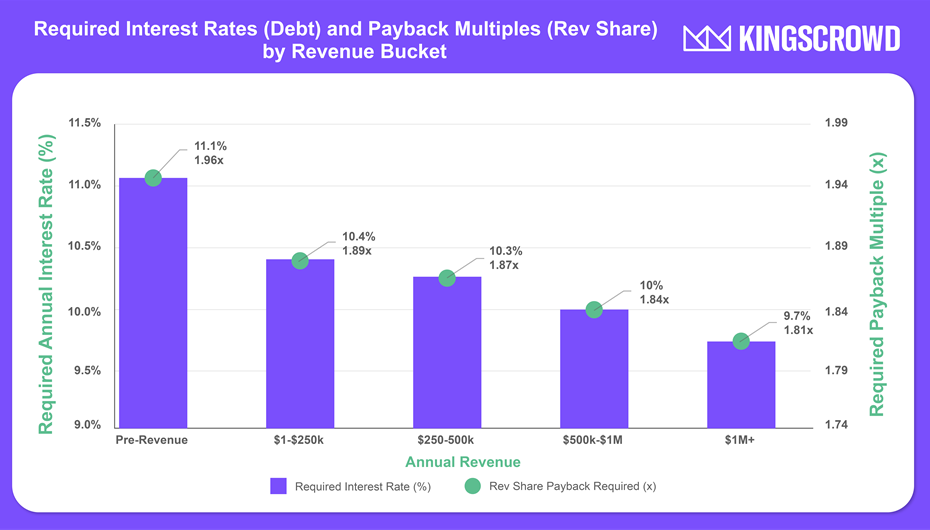
Required annual interest rates and payback multiples over 6.4 years for investors holding a diversified portfolio of debt and revenue-share Reg CF deals to break-even after accounting for failures and risks.
TLDR: to adequately compensate Reg CF investors for risk and opportunity costs, we estimate that the current average debt interest rate should be roughly 11.1% on pre-revenue deals and 10.2% on post-revenue deals. For revenue share notes, the break-even payback multiple should be a minimum of 2X for pre-revenue deals and 1.9X for post-revenue deals.1
Other key takeaways:
- The average debt interest rate for Reg CF and Reg A offerings since mid-2022 was 11.2% over an average maturity term of 6.4 years.
- The overall failure rate of debt/revenue-share businesses is 4.5% (70 out of 1,569 offerings), occurring on average 1.9 years after their last offering.
- As one would expect, pre-revenue companies were the riskiest and commanded the highest interest rate to compensate investors for the risk of failure. Pre-revenue offerings have seen 54 failures to date (5.4%), vs. 1.5-3.0% for post-revenue companies.
- Only one company with over $500k in revenues has failed thus far, suggesting higher revenues may indicate lower risk (0.7% failure rate for >$500k in revenue).
- Break-even interest rate for investors: 11.1% for pre-revenue deals and 10.2% for post-revenue deals, assuming a 4.3% risk-free rate and 5% risk premium. This is remarkably close to the overall average 11.2% interest rate since 2022.
- For lower-risk deals (over $1M in annual revenues), investors may be able to get away with lower interest rates around 9.7% (or a 1.81X payback multiple over 6.4 years).
- However, the average rev share payback multiple (1.17X) and rev share percentage (5.5%) for revenue share deals may indicate that revenue share deals may not be compensating investors as fairly for investment risk.
While these calculated break-even interest rates for Reg CF investors only considered failed businesses that did debt/rev-share offerings, there are likely more companies that have been delinquent on payments or that failed to repay investors but haven’t formally closed yet. For that reason, we doubled the assumed number of failed repayments for these break-even interest rate calculations.
1Disclaimer: these numbers are estimated based on failure rate estimates to date, and past-performance is no guarantee of future results. While these averages are derived from aggregate data, the risk of any one individual deal failing is still possible, so remember that investing in any deal — even debt offerings — carries the risk of the complete loss of capital.
Details of the Break-Even Interest Rate Calculations
In order to calculate the effective break-even rate for investors, we took an approach that considered the opportunity cost of capital for investors (U.S. 10-year Treasury yield), adjusted for the failure rate to date, and applied a third “risk premium” to account for other risks such as illiquidity. Thus, the formula for the break-even investor rate on debt and revenue share deals was:
rbreak-even = rrisk-free+ radjusted-failure + rpremium
Where:
- rbreak-even: Break-even Interest Rate (%)
- rrisk-free: Risk-Free Rate (%) – 10-year Treasury yield
- radjusted-failure: Adjusted Failure Rate Risk (%) – annualized
- rpremium: Risk Premium (%) – cost and risk of illiquidity, uncertainty, etc.
Thus, assuming the following values, we calculated the overall estimated break-even debt interest rate to be 10.8% for investors, which corresponds to a minimum payback multiple of 1.92X over an average 6.4-year term length:
- rbreak-even = rrisk-free (4.3%) + radjusted-failure(1.5% annualized) + rpremium(5%) = 10.8%
- Corresponds to a minimum 1.92x payback multiple over 6.4 years
First, we used the current U.S. 10-year Treasury yield of 4.26% as the “risk-free” rate. This is because investors could just as easily put their money into 10-year Treasuries (or many U.S. savings accounts, which offer 4.6-5%) and earn 4.3-5.0% interest on their cash with effectively zero risk. It would be hard to justify putting your hard-earned dollars into a deal that had a chance of not returning your capital when you can get 4.3% interest that is effectively backed by the promise of the U.S. government. Remember, nothing is 100% risk-free, but historically, U.S. Treasuries have been as close to risk-free as you can get when investing.
The fact that some debt interest rate offerings are even below this risk-free rate should be an immediate yellow flag for investors that they may be able to allocate their capital to less-risky ways of investing to earn comparable returns.
Failure Rates of Debt/Rev Share Companies
Next, we accounted for current failures of debt and revenue-share offerings to get a predicted charge-off rate. A charge-off is a declaration by a creditor that an amount of debt is unlikely to be collected, typically after a prolonged period of non-payment. As a reference, one of the leading top debt crowdfunding platforms publicly shared with us that they have seen a roughly 6% charge-off rate to date.
While KingsCrowd doesn’t know the actual charge-off or delinquency rates of repayments to investors, we can approximate the charge-off rate by estimating the number of companies that will shut down and then adding in a conservative buffer to account for additional failures and late or partial payments.
Based on current company failures that KingsCrowd tracks, we see that the failure rate ranges from 5.4% for pre-revenue companies to as low as 1.4% for companies with more than $1 million in annual revenue:
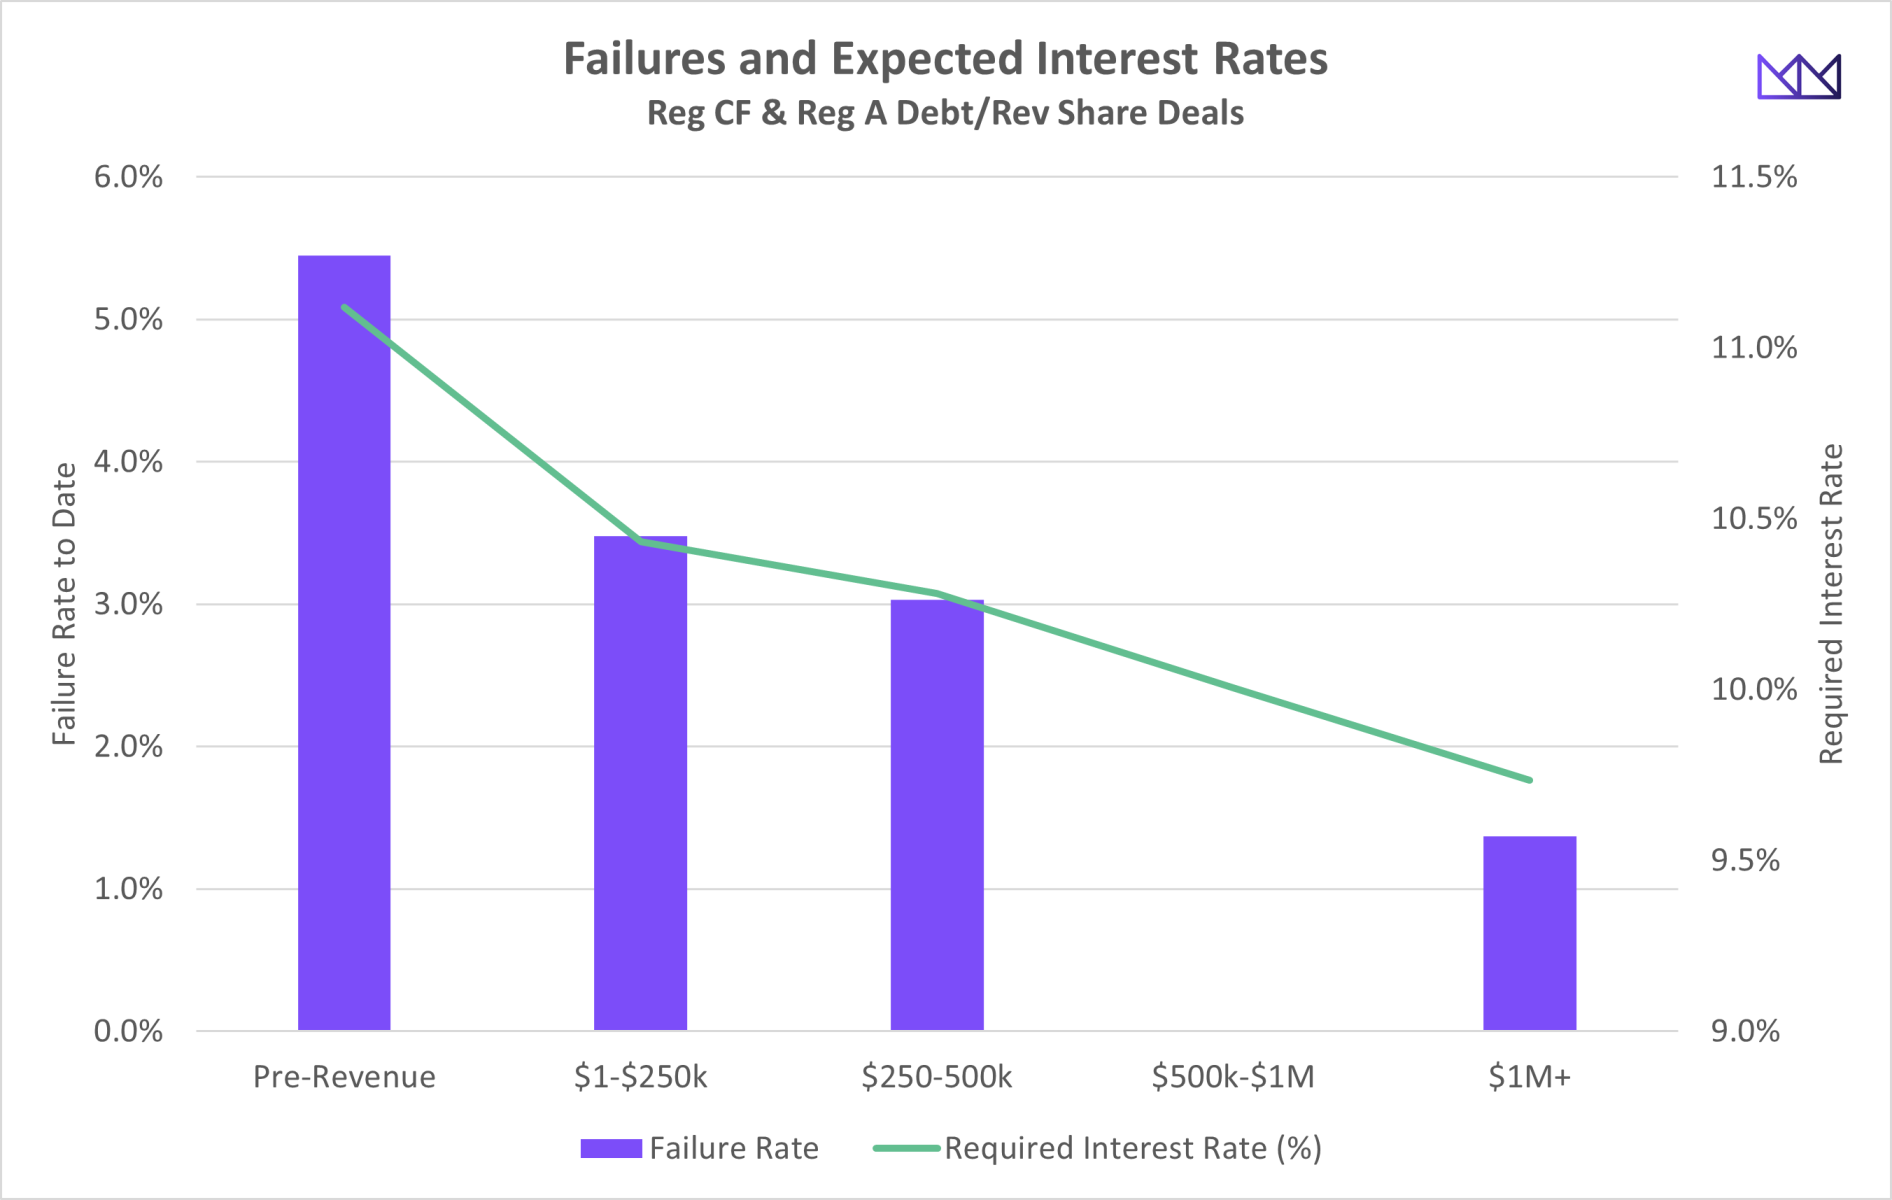
Note that there were no failures currently reported in the $500k-$1M revenue bucket.
After determining these rates for each revenue bucket, we examined the ‘effective’ term length of debt and revenue share offerings since 2022, which we found to be 6.4 years on average.
The statistical averages from the 1,569 debt/rev share deals analyzed since 2022 were:
| Avg. Term Length | 6.4 years |
| Avg. Debt Interest Rate | 11.2 % |
| Avg. Rev. Share Payback Multiple | 1.17X |
| Avg. Revenue Share Percent | 5.51% |
| Avg. Days to Failure after last raise | 702.1 days (1.9 years) |
Using a 6.4-year average maturity term, we could then calculate the effective annual interest rate premium that would be required to compensate investors for failure. We also assumed that there would be twice as many repayment failures than we have recorded to date (e.g. in total, 70*2 = 140 failures out of 1,569, or ~9%). The reason we doubled the number of failures is that companies may be delinquent or default on payments yet still be in business. Also, more companies will likely fail in the future that have not yet been accounted for, and there are also likely some companies that have already silently failed but not yet announced their closure publicly.
While our calculations accounted for roughly 10% failures (with the 2X factor for unaccounted for failures), you can use the following chart to change the assumed failure rate by including additional interest rate adjustments to compensate for higher failures:
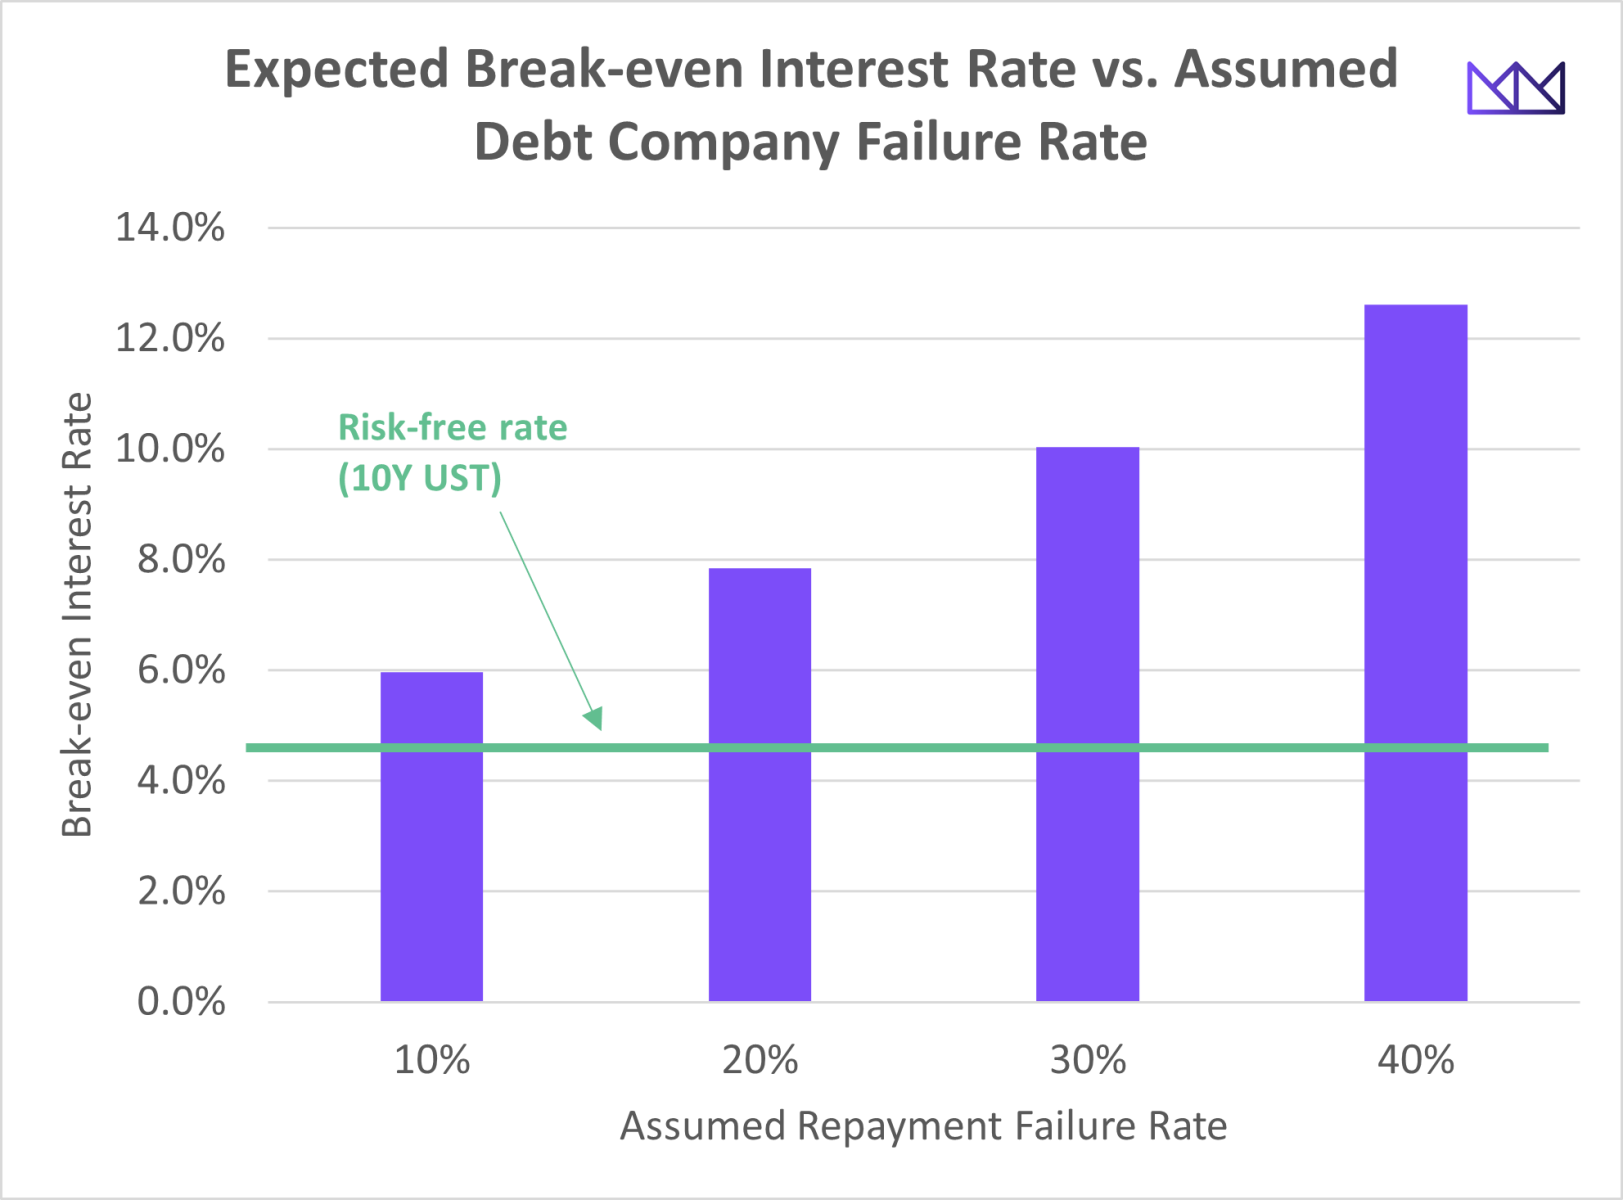
Now, using the ~10% failure rate, we’re at a ~6% interest rate being required for investors — which includes 4.3% from the 10-year yield and an additional 1.7% to compensate for annualized failures. However, that would simply be the interest rate required to break even – when in reality, investors would also like to make a little money, as well as be compensated for additional risks they take such as illiquidity.
Lastly, we applied a third factor, which was an additional risk premium to account for the fact that investing in early-stage debt and revenue share deals not only comes with a high risk of failure (already accounted for in the prior step), but also additional risks of illiquidity, default risk (delayed or defaulted payments), and other economic uncertainties. All of these risk factors will lead investors to demand a higher rate of return for taking on the additional risks and constraints (e.g. not being able to access your cash when you need it). We used a risk premium of 5% to account for these factors.
Thus, we end up with the required interest rate for investors to be compensated for risk and opportunity cost of investing in Reg CF debt deals:
| Annual Revenue | Risk-free rate (10-year yield) | Failure rate premium (annualized) | Risk Premium (illiquidity, etc.) | Required Interest Rate |
| Pre-Revenue | 4.3% | 1.8% | 5% | 11.1% |
| $1-250k | 4.3% | 1.1% | 5% | 10.4% |
| $250k-500k | 4.3% | 1.0% | 5% | 10.3% |
| $500k-1M | 4.3% | 0.7% (interpolated) | 5% | 10.0% |
| Over $1M | 4.3% | 0.4% | 5% | 9.7% |
| Overall | 4.3% | 1.5% | 5% | 10.8% |
How Does this Compare to Debt Crowdfunding Platforms?
As an anecdote, we heard a top debt crowdfunding platform recently share publicly that they determine the interest rate for their issuers based on the current Prime Rate (8.5%), plus an additional 1-5% risk premium rate. This would imply interest rates being set from 9.5% for the least-riskiest investments to 13.5% for the most risky investments.
Note: the Prime Rate is the interest rate that commercial banks charge their most credit-worthy customers, typically large corporations. It’s often used as a benchmark for various loan products, including business loans and credit cards.
As we can see, this funding platform with 9.5%-13.5% interest rates seems to be in the sweet spot for creating attractive interest rates for investors based on our analysis.
Have Debt Interest Rates in Reg CF Changed Over Time?
Since KingsCrowd started collecting detailed data on the debt and revenue-share deal terms (most deals since 2022), debt interest rates on Reg CF and Reg A offerings have been relatively stable, despite a much larger increase in the effective fed funds rate over that time.
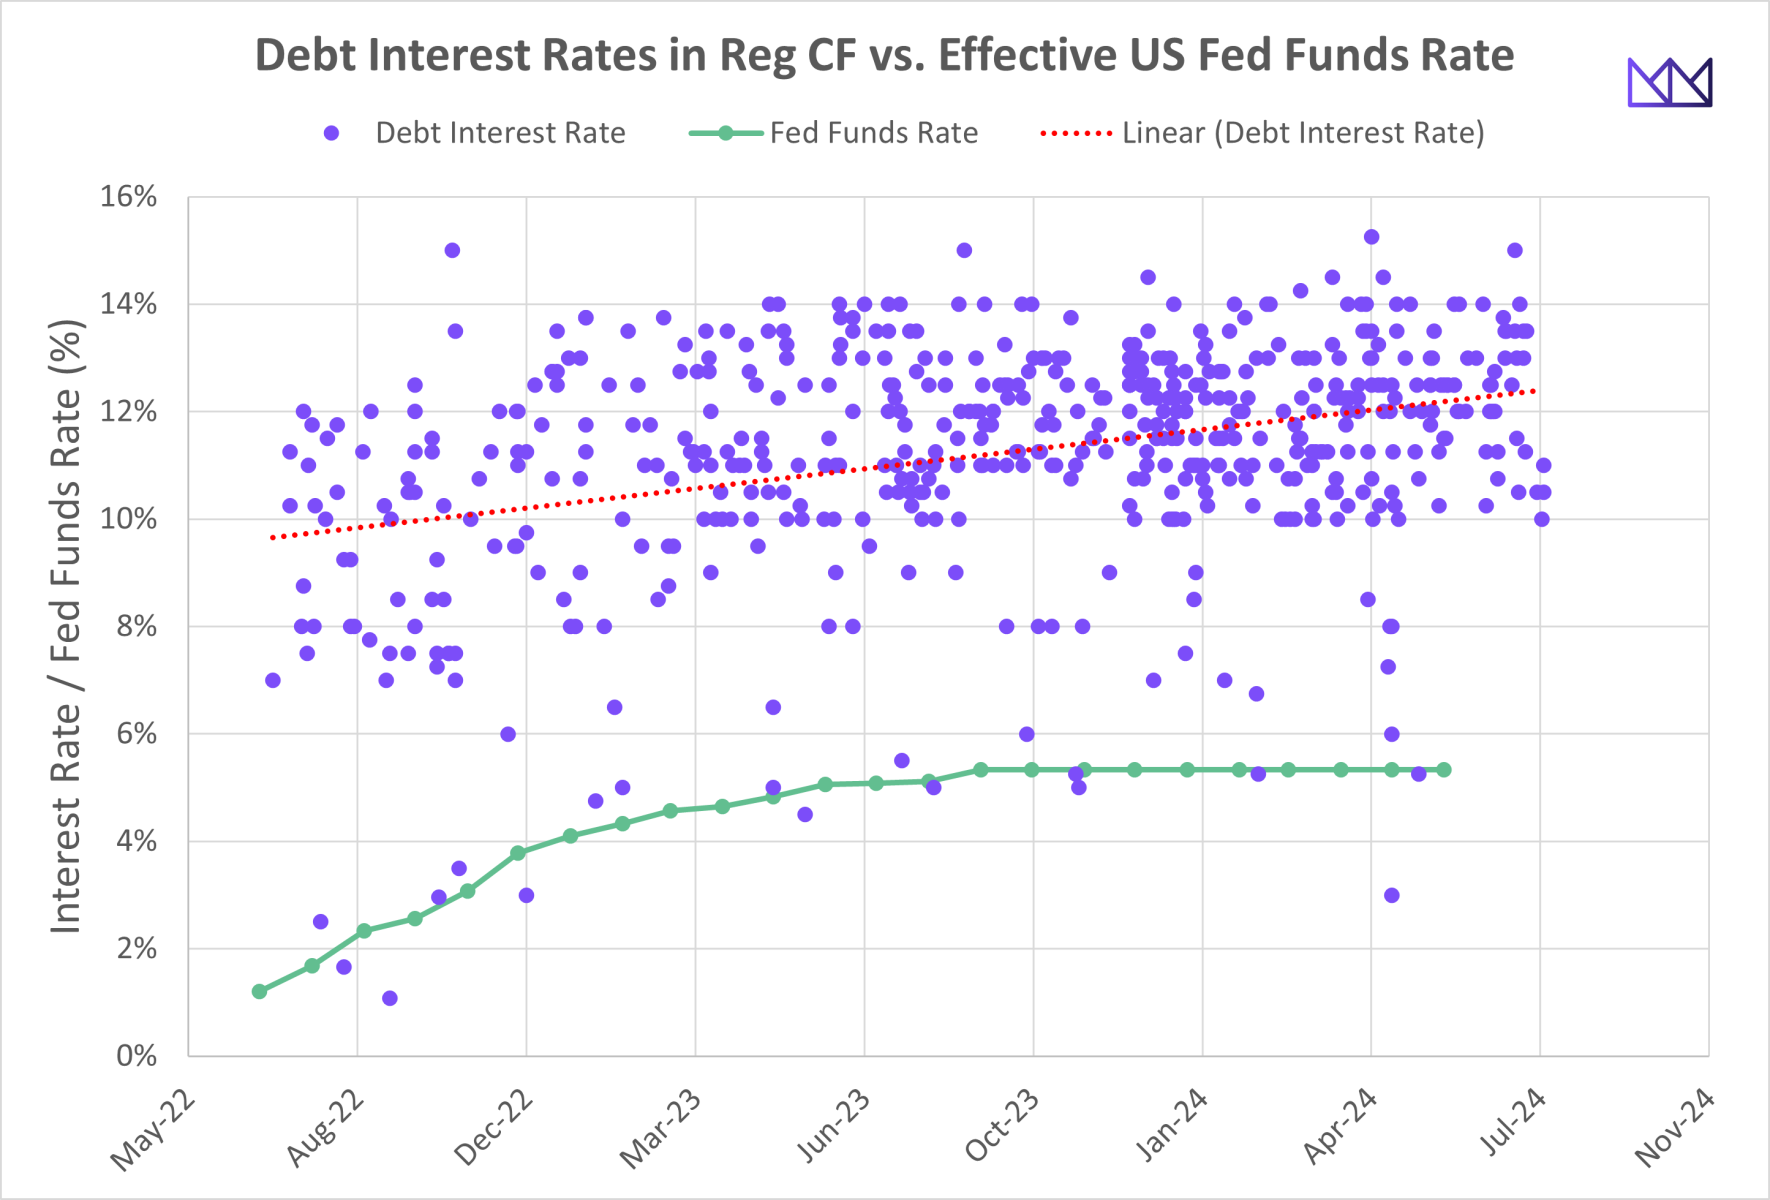
While the linear trendline (dashed red line) for debt interest rates has seen a moderate increase (~+2.4%) since mid-2022, debt interest rates have not increased as much as the effective Fed Funds rate in the U.S. (green line), which went from roughly 1% to 5.33% over the same period. This suggests that earlier debt deals may have actually been even more attractive to investors due to their generous interest rates, while current debt offerings with interest rates around 12% on average are now more fairly priced.
Debt Interest Rate Differences by Funding Platform
Another question we explored is whether there tends to be a debt interest rate difference across platforms. While many of the funding platforms have only had 1 debt offering since 2022 (with interest rate data available), we can see that Honeycomb is the clear leader in terms of both the number of debt offerings and the average interest rate (12.2%) among platforms with multiple offerings.
Meanwhile, other platforms seem to have average interest rates far below the calculated 10.8% investor break-even threshold – potentially indicating that investors may not be adequately compensated for risk, even if the failure rates are significantly lower on those platforms.
| Funding Platform | Avg. Interest Rate | # Debt Offerings |
| Untold | 15.0% | 1 |
| Oversubscribe Portal | 13.5% | 1 |
| Honeycomb | 12.2% | 381 |
| Secure Living | 12.0% | 1 |
| Dealmaker Securities | 10.1% | 2 |
| Silicon Prairie Online | 10.0% | 1 |
| CrowdSource Funded | 10.0% | 1 |
| Republic | 10.0% | 1 |
| Folla Capital | 10.0% | 1 |
| SMBX | 10.0% | 119 |
| Climatize | 9.5% | 11 |
| Dalmore Group | 9.0% | 1 |
| Wefunder | 8.8% | 12 |
| Small Change | 8.5% | 4 |
| StartEngine | 8.0% | 1 |
| Common Owner | 8.0% | 1 |
| Infrashares | 8.0% | 1 |
| PicMii | 7.0% | 1 |
| Self Managed | 6.3% | 2 |
| Vicinity | 6.0% | 1 |
| Crowd Fund Baltimore | 6.0% | 1 |
| Angel Funding | 6.0% | 1 |
| Raise Green | 5.2% | 13 |
| EquityVest | 4.3% | 1 |
| CrowdFund Montana | 3.5% | 1 |
| CrowdFund Mainstreet | 3.0% | 1 |
| MainVest | 2.2% | 4 |
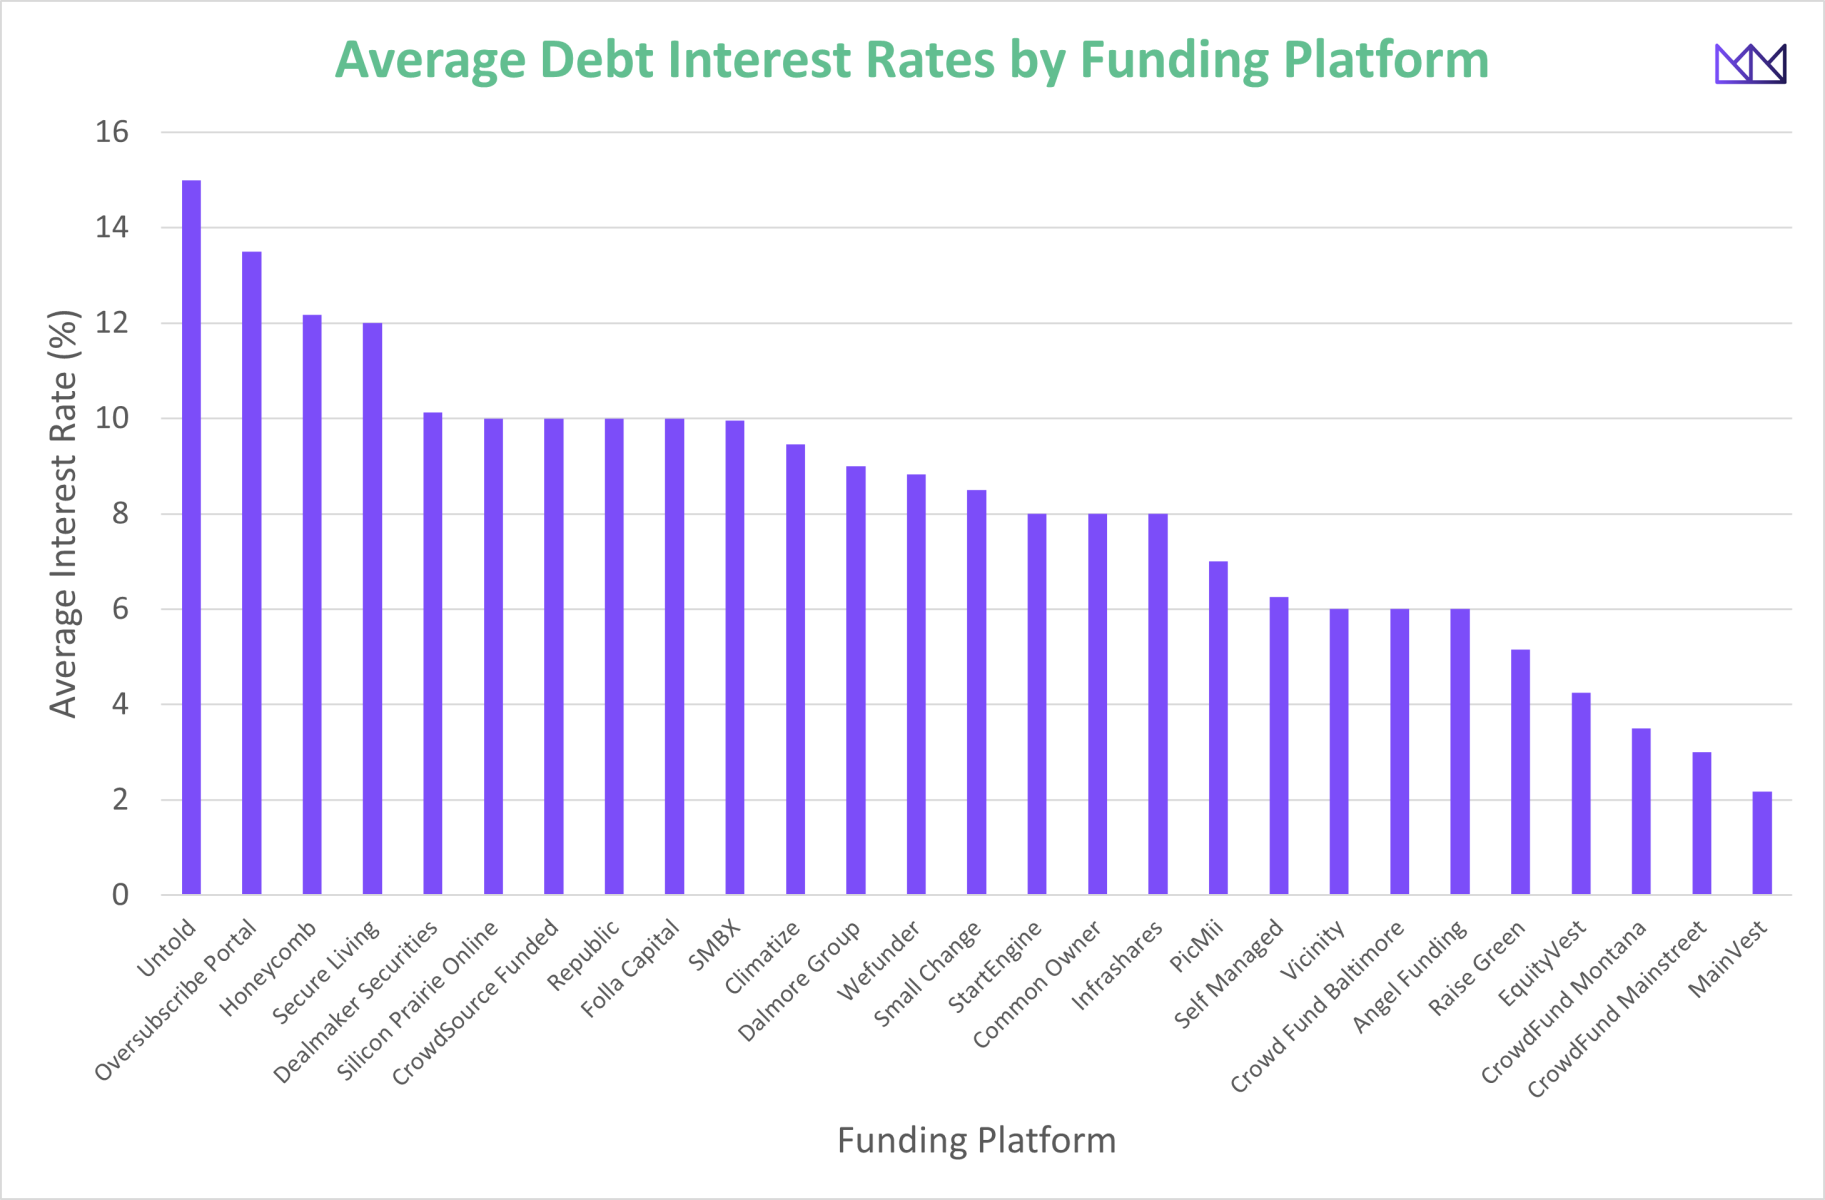
Debt offering interest rates by platform since 2022.
Summary
So, are current debt and revenue-share interest rates fair for investors? Our deep dive suggests that they’re pretty close.
To properly cover the risks of startup failures, opportunity costs, and other factors like illiquidity, we estimate that pre-revenue deals should have an interest rate around 11.1%, while post-revenue deals should be about 10.2%. This lines up well with the average rate of 11.2% we’ve seen across recent offerings.
However, revenue-share deals with an average payback multiple of 1.17X might not be giving investors enough bang for their buck. There are debt crowdfunding platforms out there that seem to be hitting the right mark, setting interest rates that fairly compensate investors for the risks they’re taking when investing in small business debt offerings.
Register for FREE to comment or continue reading this article. Already registered? Login here.
6

Very helpful @Brian Belley! Thanks for posting.